Reports
Reports answers the questions a ministry, a customs administration or a REC asks about transit: how much is moving, where it waits, what is still open, what ITS refused, and who stamped what. It is split into five areas, each a page of tiles, plus All reports, the library of the 24 saved reports those tiles are drawn from.
Every figure is read live from the declarations ITS holds, limited to the countries you may see. The Secretariat reads every member state, a State Party reads itself, and a REC reads the members that submit through it.
Before you start
- You need a role that reads reports. Secretariat admin and Organisation admin read all five areas; a Customs officer reads two. See What each role can do.
- Decide the period you are asking about before you open the page. The default is This month.
- The figures take a while to arrive. Grey placeholder blocks mean a tile is still loading, not that it is empty.
How to open it
Select Reports in the header, or open All areas (⌘K / Ctrl+K) and
choose Reports. The page opens on Transit volumes.
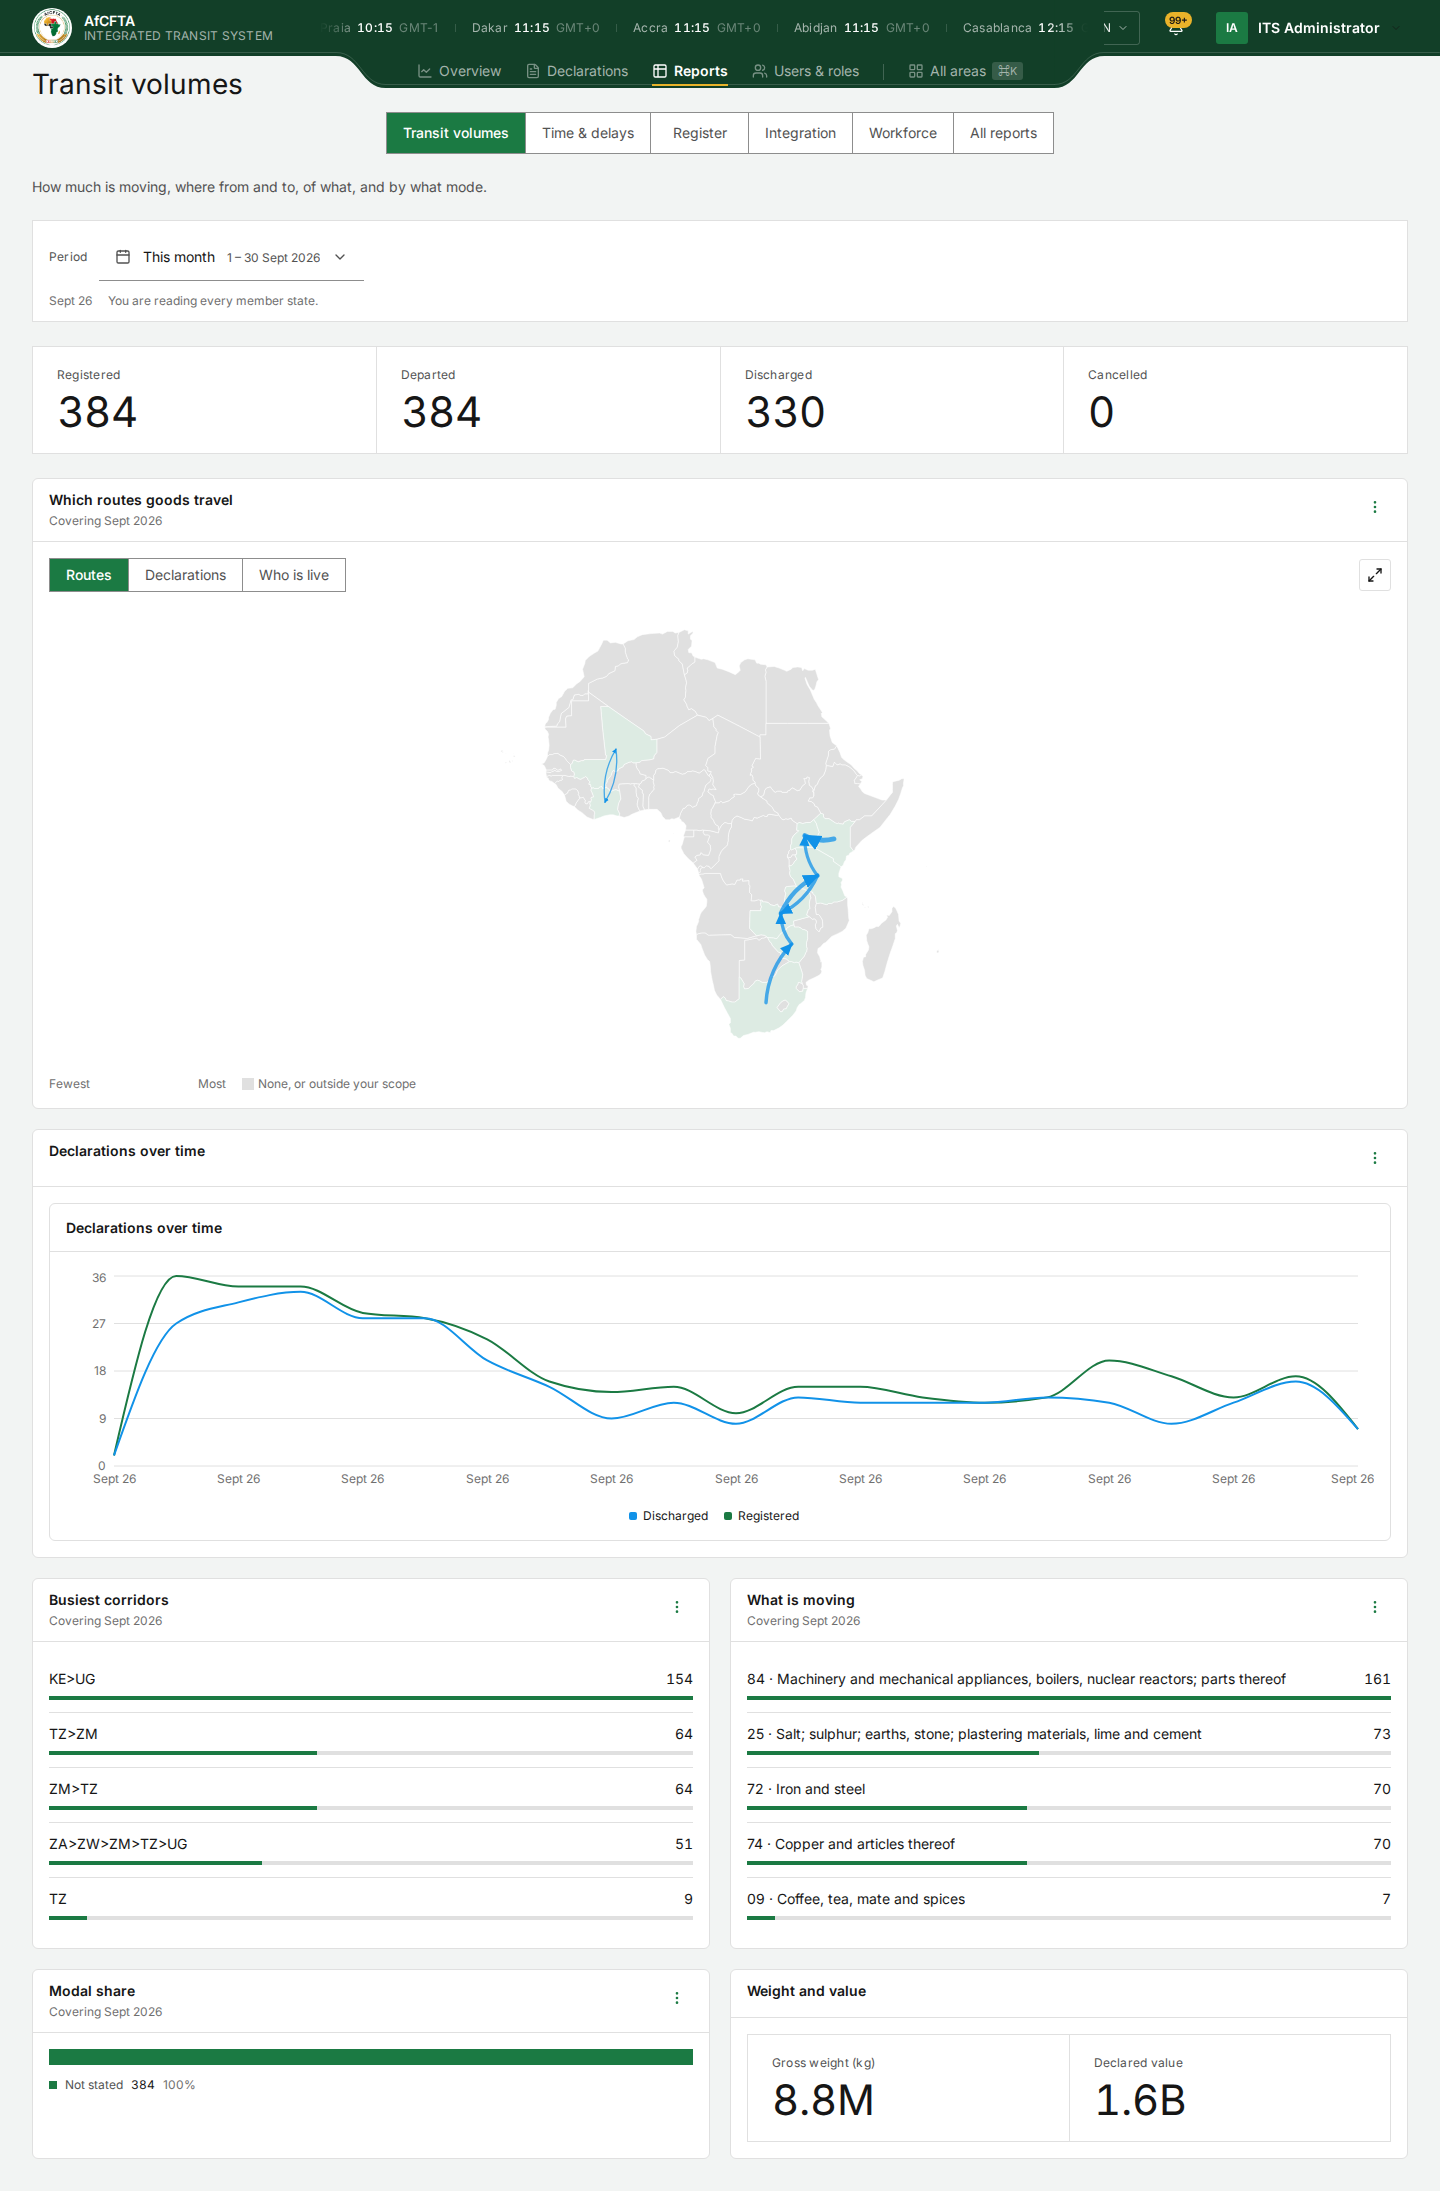
The page at a glance
| On the page | What it is for |
|---|---|
| Area tabs: Transit volumes, Time & delays, Register, Integration, Workforce, All reports | Move between the areas. You only see the tabs your role may read. |
| The line under the title | What the area is for, for example "How much is moving, where from and to, of what, and by what mode." |
| Period | The period every tile on the page is read for. See Choose the period. |
| Scope (RECs only) | Read the whole community or one member. See The REC scope picker. |
| The small caption ("Sept 26") and the sentence "You are reading …" | Which period and whose data the page shows. See Whose data you are reading. |
| Headline figures | Four numbers for the period, such as Registered, Departed, Discharged, Cancelled. |
| Tiles | One chart, list or table each, with a title, "Covering …" (the months it reads) and a ⋮ Actions button. |
| Area | What it answers | Page |
|---|---|---|
| Transit volumes | How much is moving, where from and to, of what, and by what mode. | Transit volumes |
| Time & delays | Where cargo waits, and who takes longest to release it. | Time & delays |
| Register | What is open, what moved, and what was changed. | Register |
| Integration | What ITS refused, what it delivered, and who is still onboarding. | Integration |
| Workforce | Who stamped what, where, and how promptly. | Workforce |
| All reports | Every saved report, by name. | All reports |
Choose the period
One period applies to the whole page, so every tile answers the same question.
-
Select the Period field (it reads, for example, This month 1 – 30 Sept 2026).
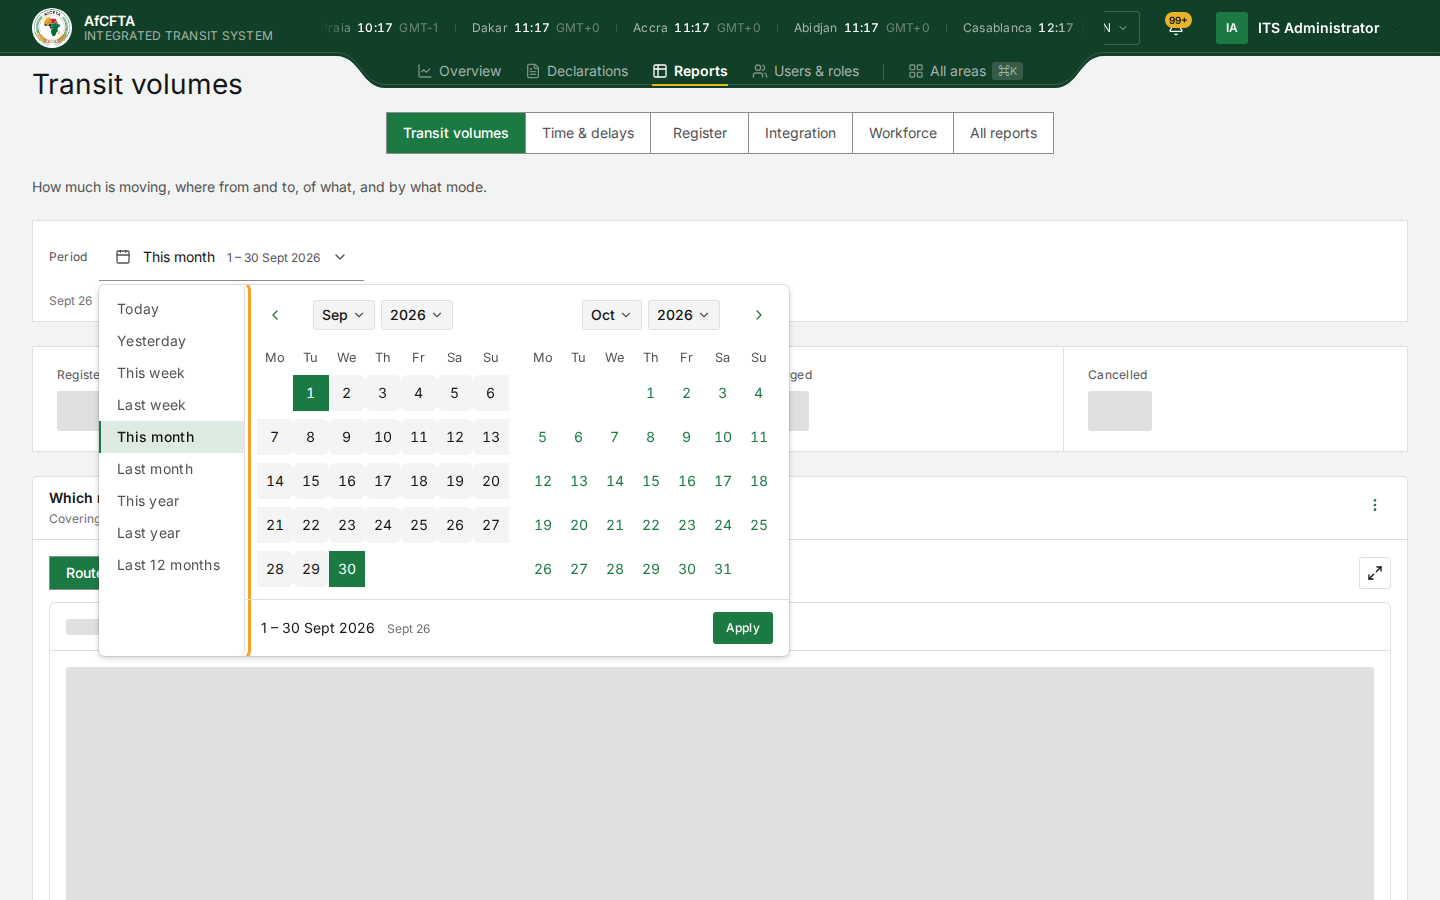
-
Either select a named period on the left: Today, Yesterday, This week, Last week, This month, Last month, This year, Last year or Last 12 months. It applies at once.
-
Or pick a first and a last day on the calendar and select Apply.
| What you choose | What happens |
|---|---|
| A named period | Applied immediately. A link to the page keeps the name, so "This month" opens on whichever month it is opened in. |
| Dates that make a whole day, week, month or year | Applied as that period, and named as such. |
| Dates that are not a whole period (for example 5–20 August) | The picker says That range isn't a whole period, and readings are only stored per period. and offers Use August 2026. Take the offer, or pick other dates. |
Weeks start on Monday.
Medians and percentiles are stored per whole period. A rolling seven days would give correct counts beside wrong medians, so the portal only offers whole periods. Pick seven days on the calendar if you need them, and the page tells you which whole period the figures come from.
Many tiles are only stored per month. If you choose a week, those tiles still read the whole month around it, and their "Covering …" line says so ("Covering Sept 2026"). Read that line before comparing a tile with a headline figure.
Whose data you are reading
Under the period, every Reports page says in one sentence whose data it is showing. Check it before you quote a figure.
| You are signed in as | The sentence reads | What the page covers |
|---|---|---|
| The Secretariat | You are reading every member state. | All of Africa. There is no Scope picker. |
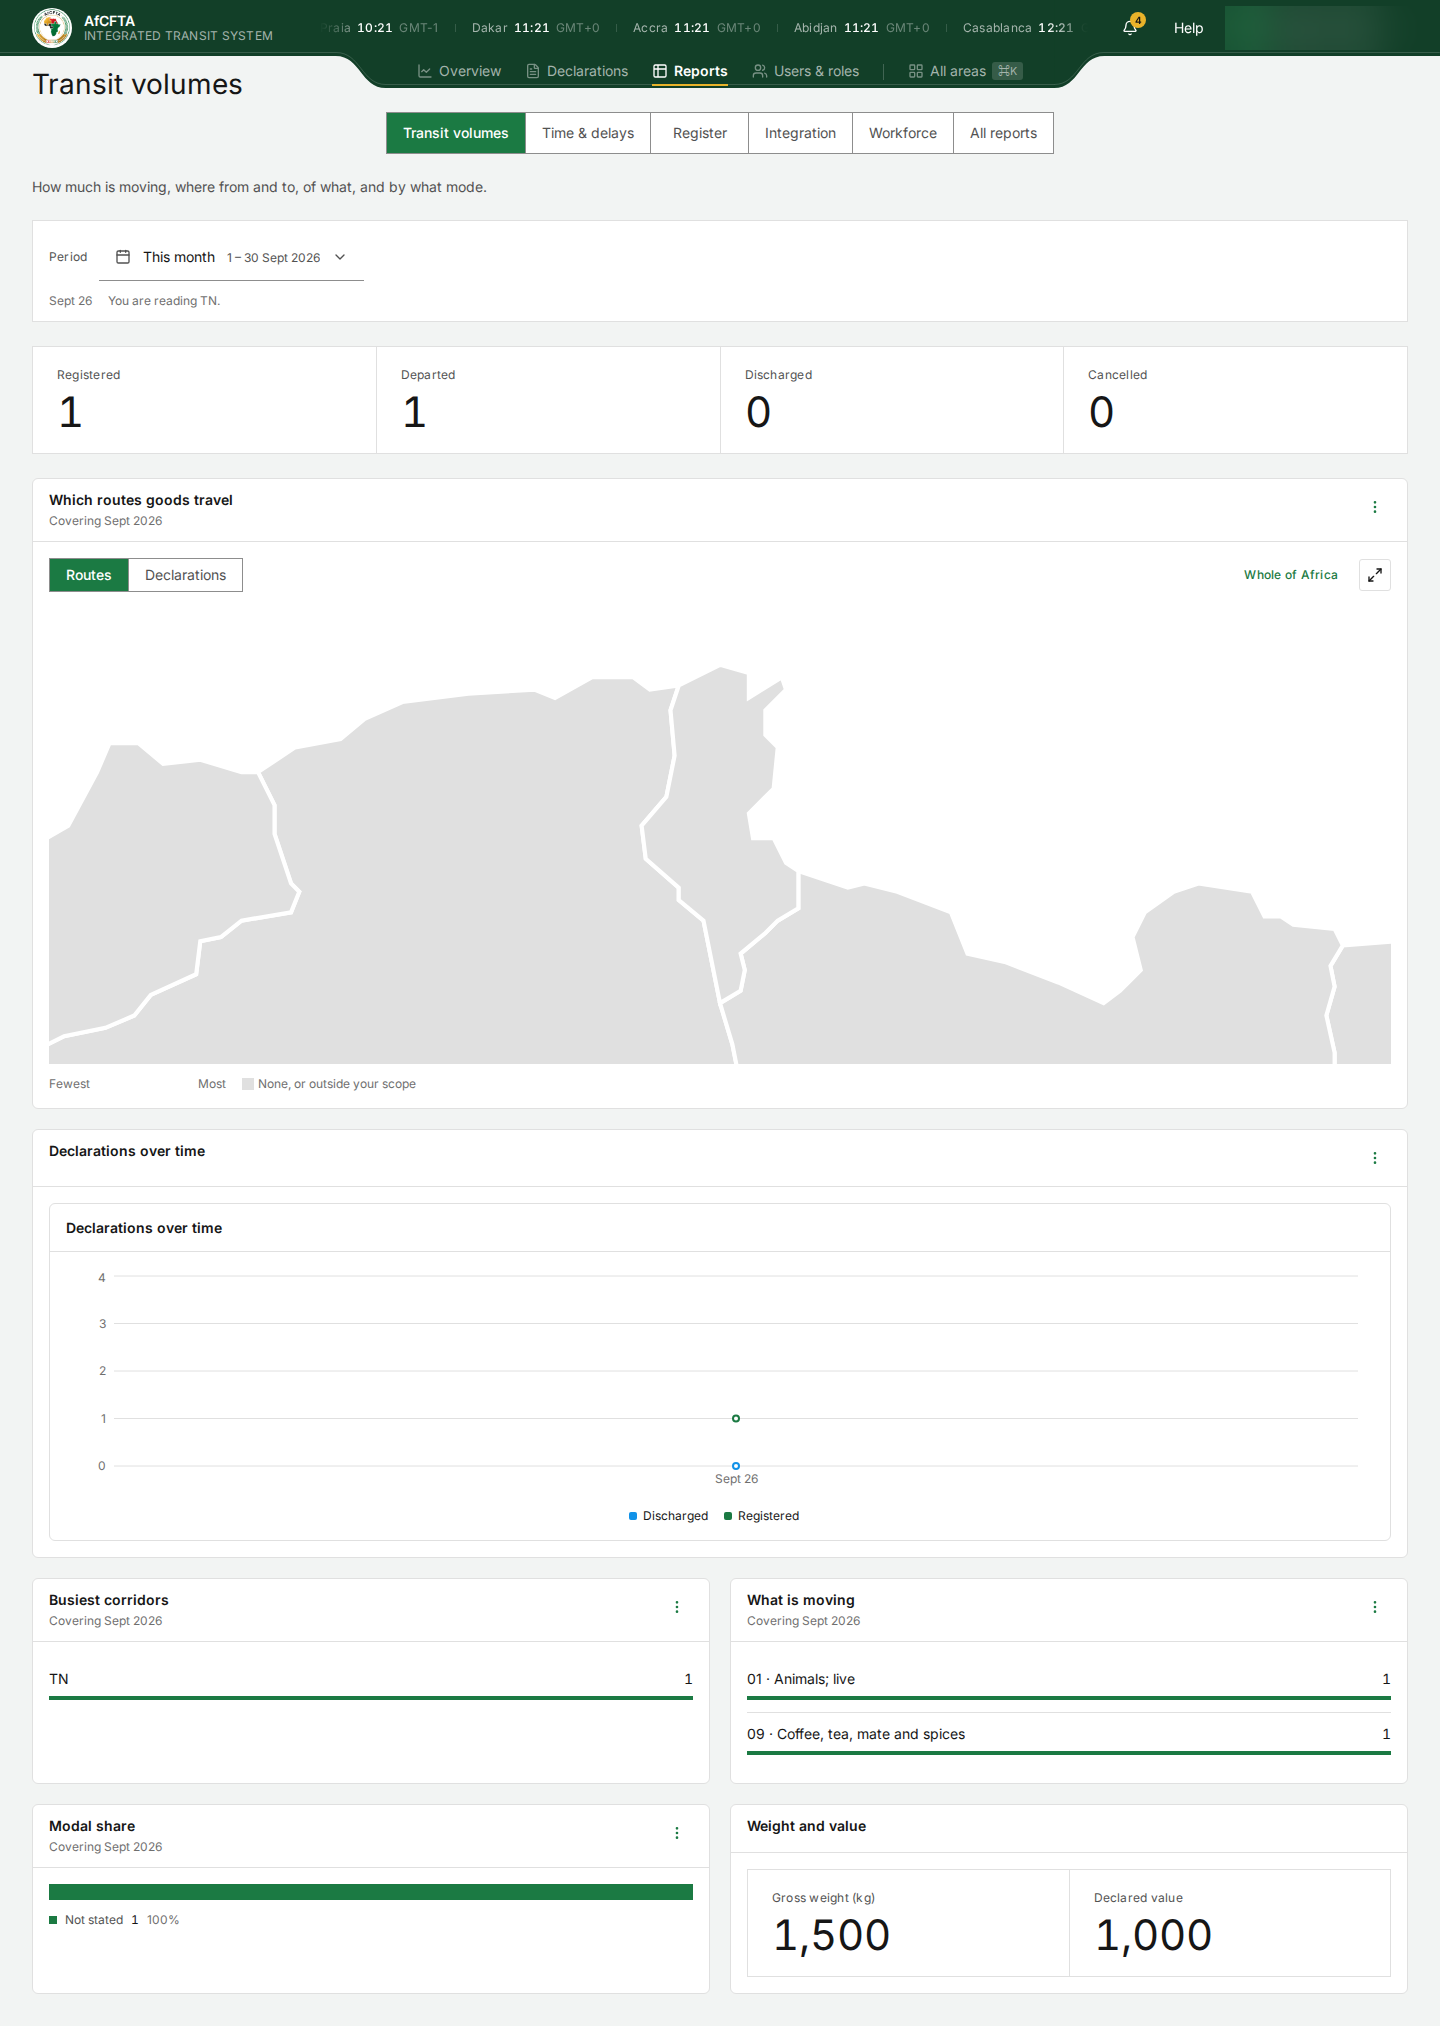
| A State Party (for example Tunisia) | You are reading TN. | That country only. There is no Scope picker. |
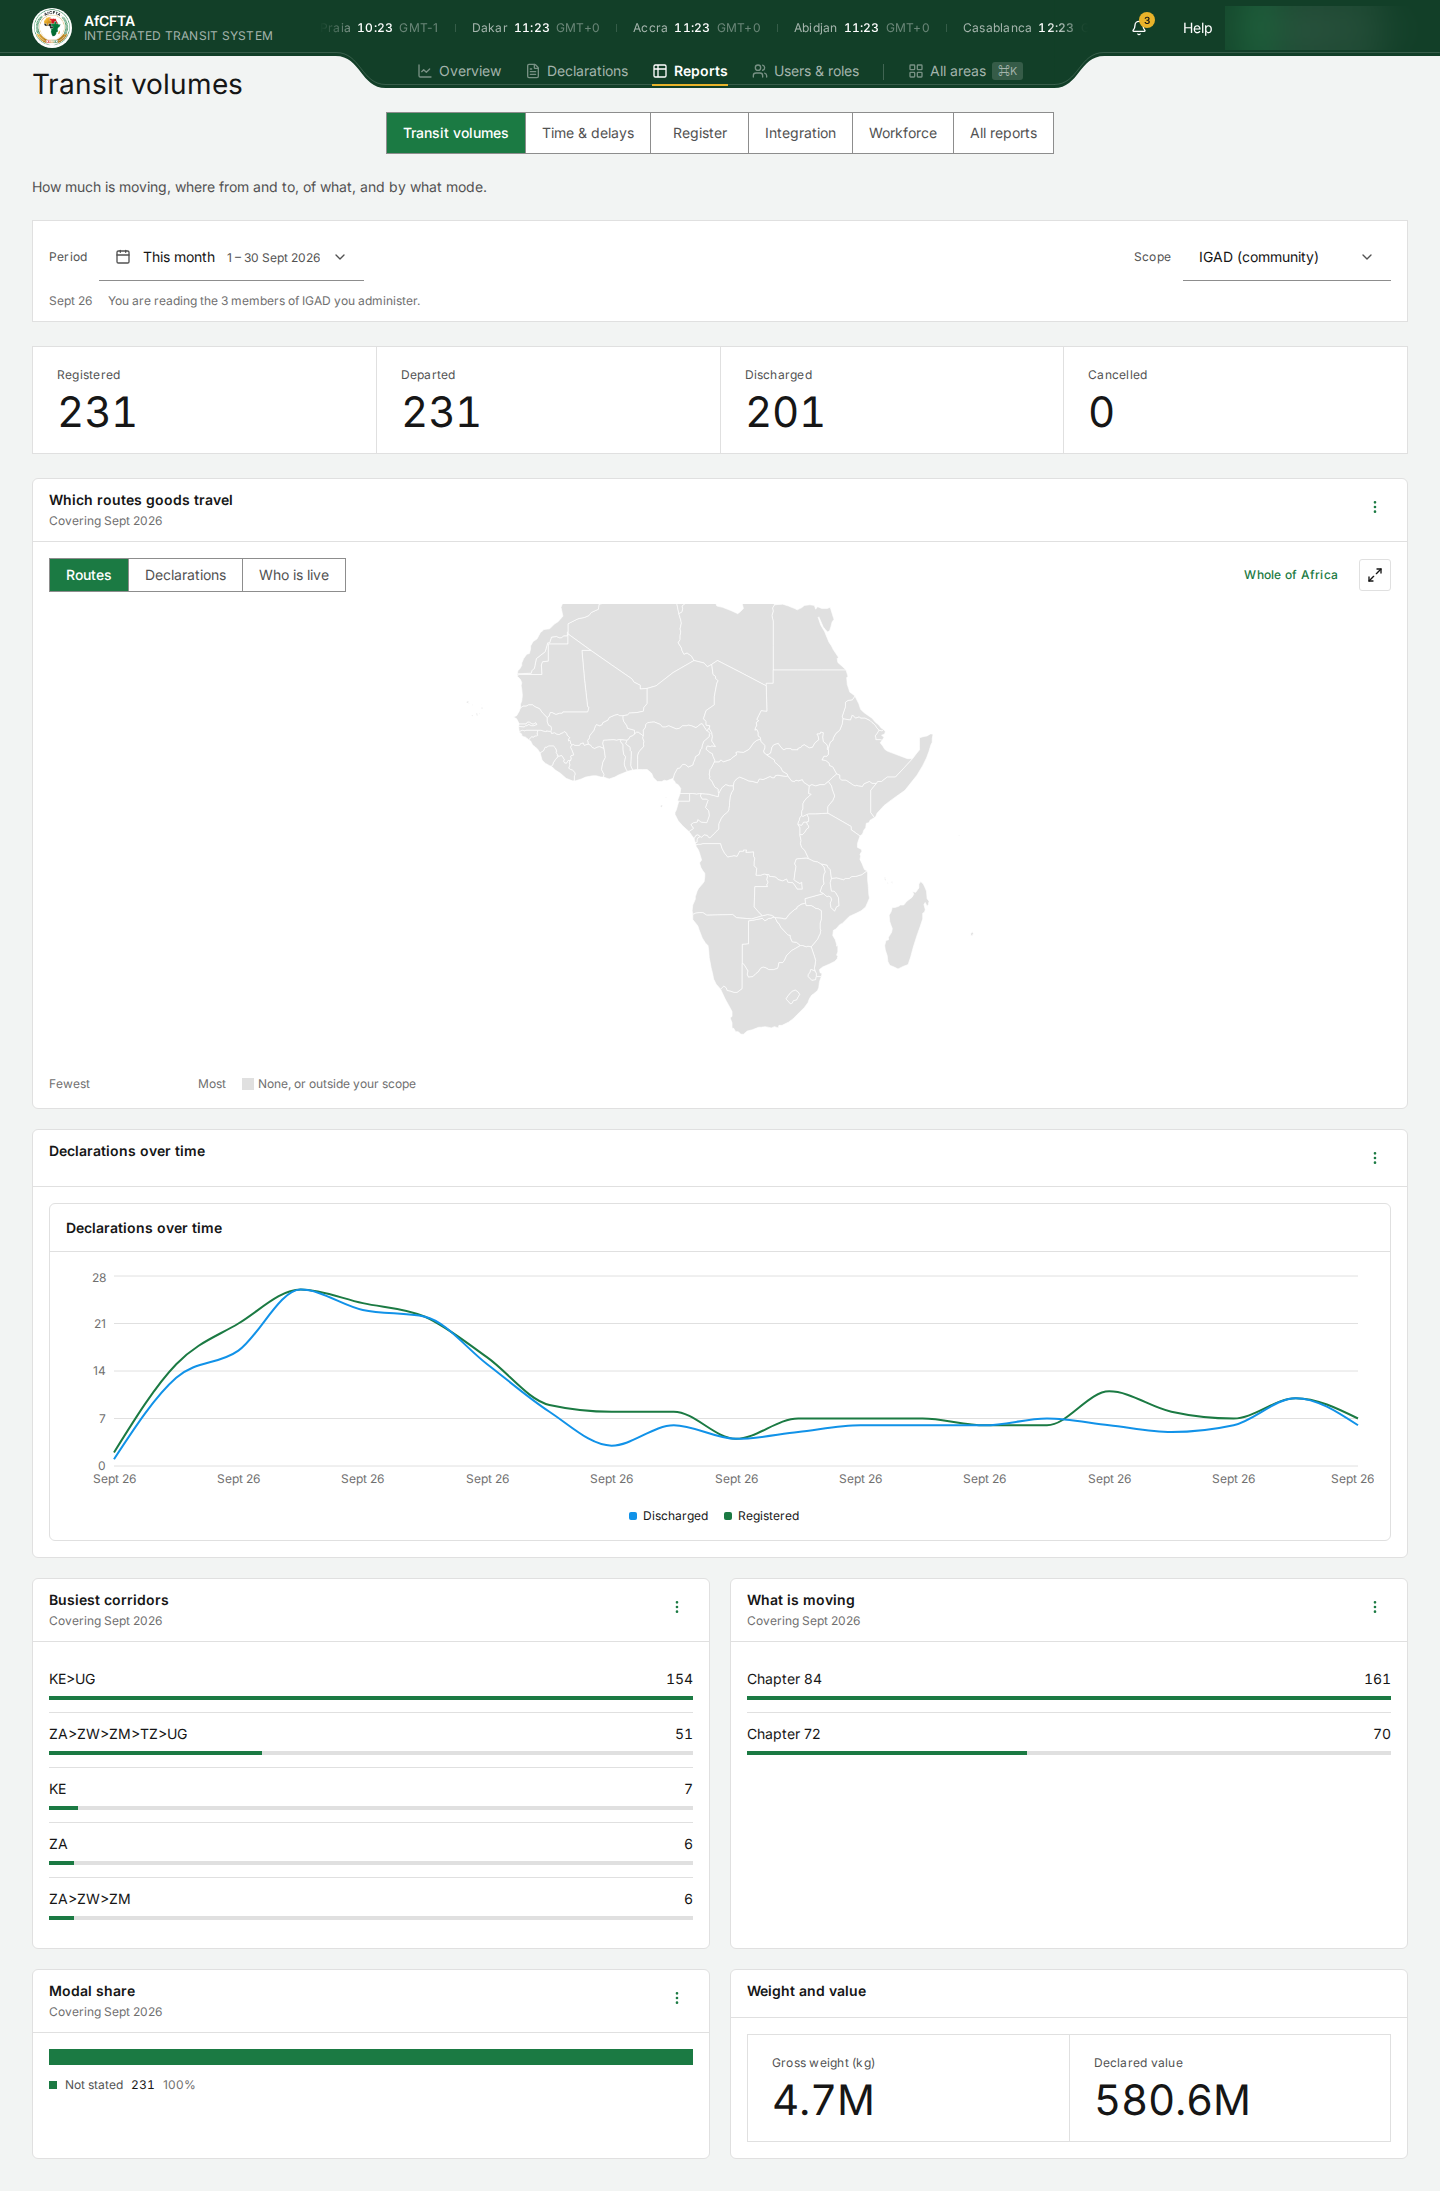
| A REC (for example IGAD) | You are reading the 3 members of IGAD you administer. | The members that submit through the REC, with a Scope picker. |
The same page as each of the three:
| Secretariat | State Party | REC |
|---|---|---|
|  |  |
The sentence changes nothing by itself: ITS limits every figure on its own side. Its only job is to tell you what you are looking at. An empty tile for a narrow scope looks exactly like a quiet week.
A State Party reads "You are reading TN." rather than the country's name. TN is Tunisia. Country codes follow ISO 3166; see the Glossary.
The REC scope picker
A REC signed in to Reports gets a Scope field on the right of the period.
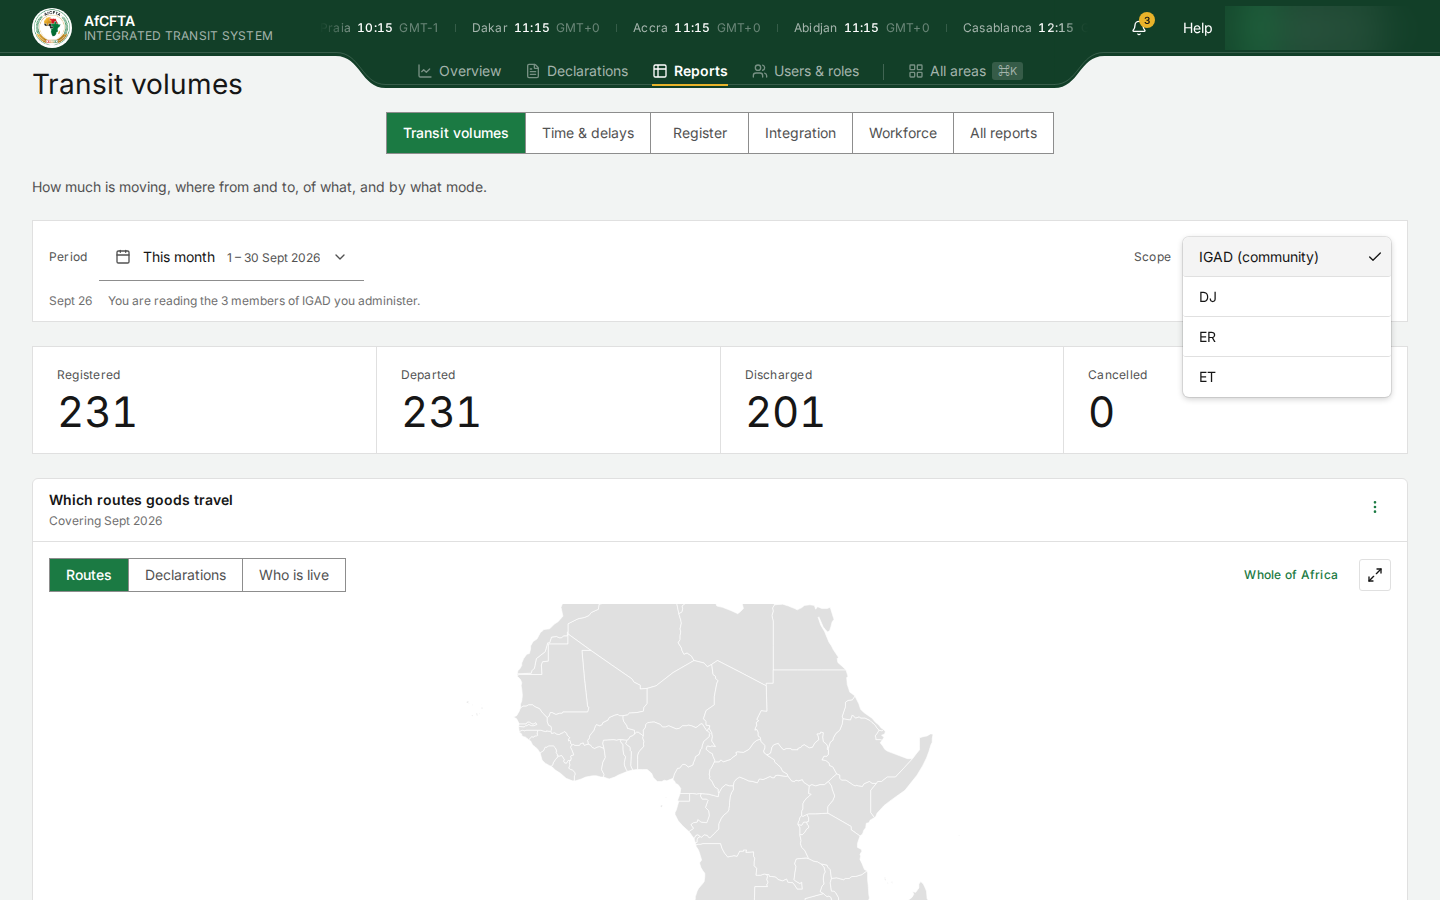
| Choice | What the page reads |
|---|---|
| IGAD (community) (your REC's code) | All the members you administer, added together. This is the default. |
| A member's code (DJ, ER, ET) | That member alone, so you can compare members one at a time. |
The members offered are the ones that submit through your REC, not every member of the community. The Secretariat records which members those are, on Governance.
On the current version, some REC figures come from a different list of members than the one ITS uses everywhere else. As IGAD, whose administered members are Djibouti, Eritrea and Ethiopia, Transit volumes and Time & delays show 231 declarations from Kenya and South Africa to Uganda, the corridors KE>UG and ZA>ZW>ZM>TZ>UG, a declared value of 580.6M and a 3.1h median crossing. Register on the same scope shows 0 lodged, and Declarations is empty.
Until this is fixed, do not quote a REC's Transit volumes or Time & delays figures without checking them against Register. If they disagree, the Register figure is the one limited to your members.
A tile's Actions menu
Every tile has a ⋮ button at its top right, named Actions for and the tile's title.
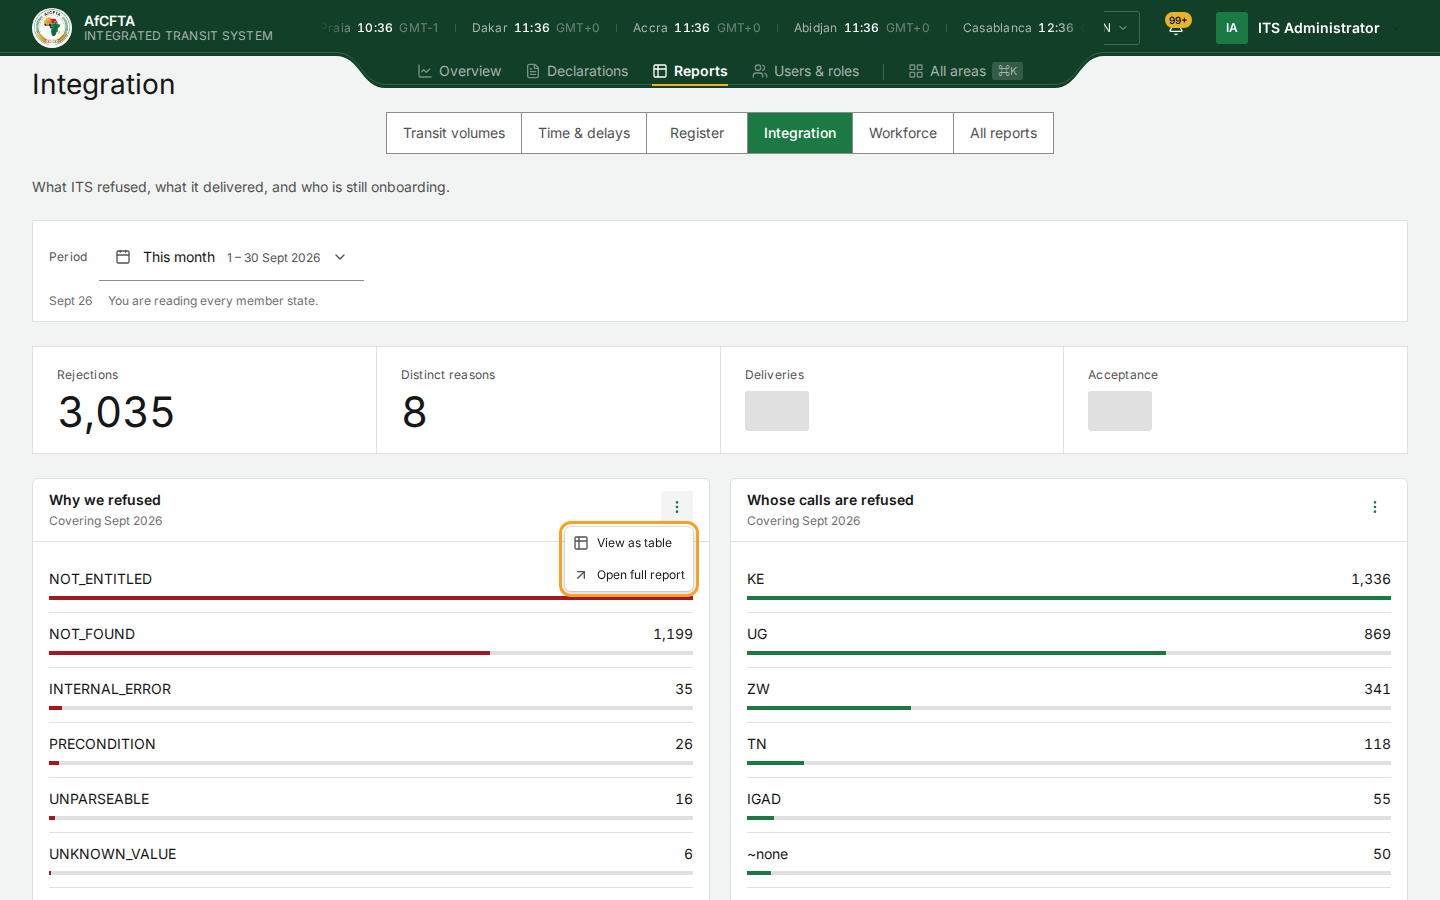
| Item | What it does |
|---|---|
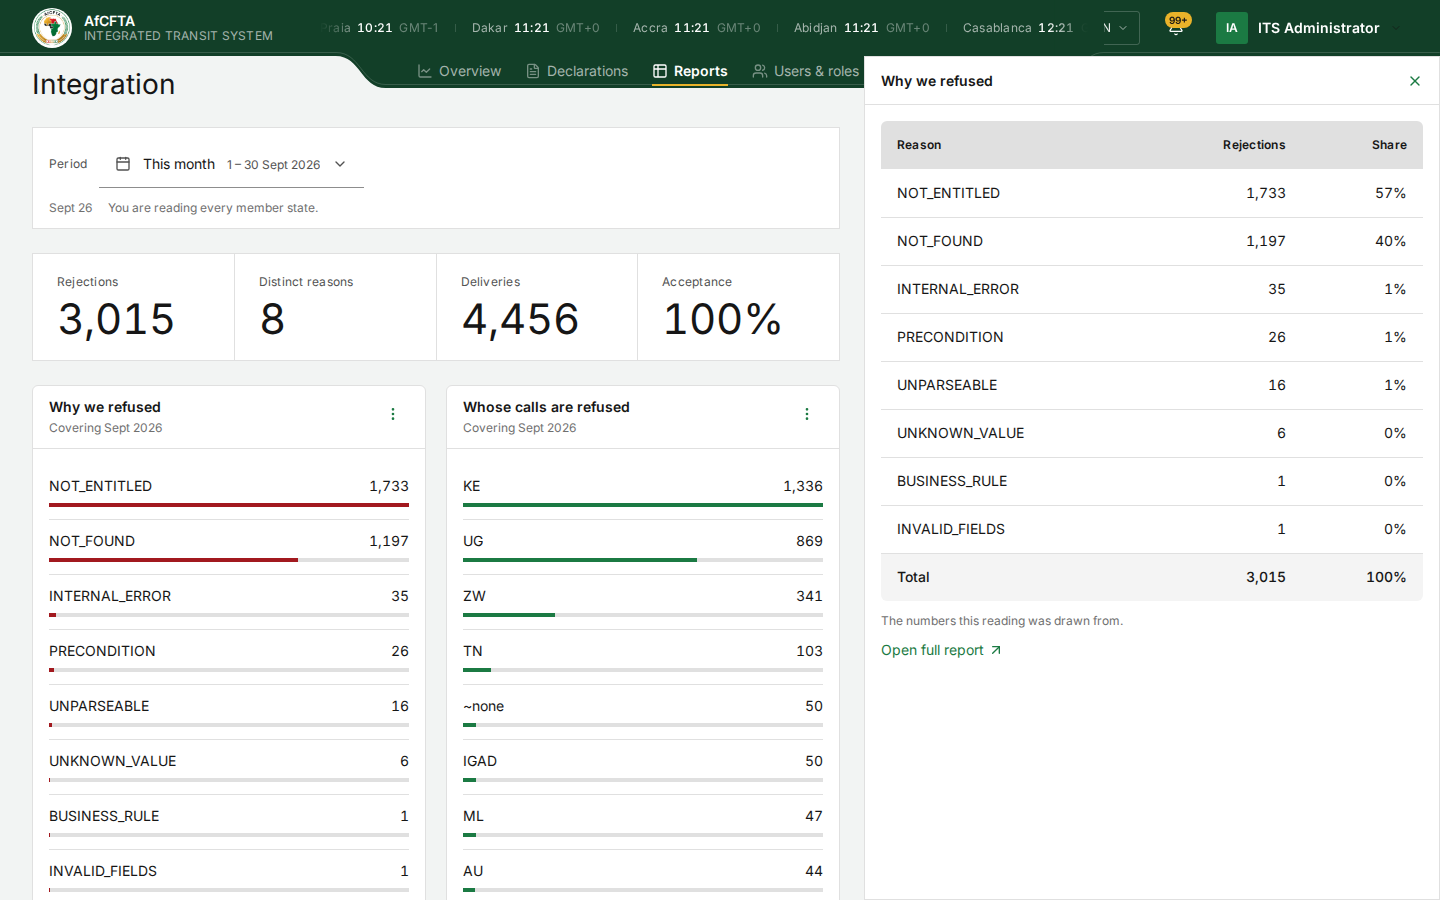
| View as table | Opens a panel at the right with the numbers the tile was drawn from. Use it to read exact values, or with a screen reader. |
| Open full report | Opens the saved report behind the tile, on the same period, where you can filter, sort and export. |
| Export | Downloads the tile's rows. Only some tiles offer it. |
Only the items a tile supports are shown.
Open a full report
Open full report on a tile, or a row in All reports, opens the report page.
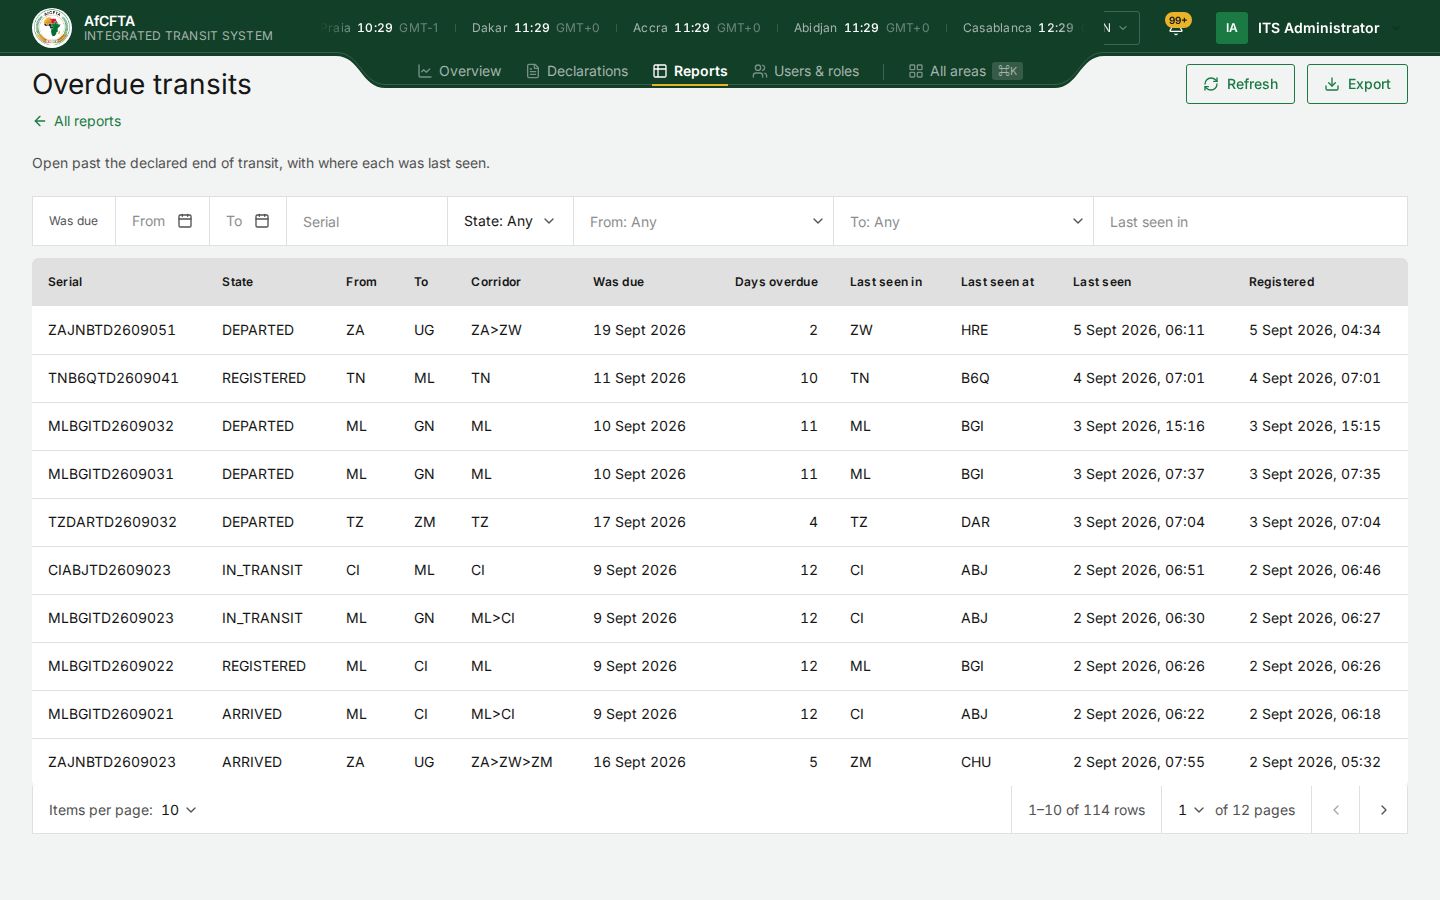
| On the page | What it is for |
|---|---|
| All reports (back link) | Returns to Reports. |
| Title and the line under it | The report and the question it answers. |
| Refresh | Reads the report again. |
| Export | Opens the export window. See below. |
| Filters | The report's own filters, and a period where the report has one. Changing a filter goes back to page one. |
| Table | The rows, a page at a time, with the total underneath. |
The filters are kept in the page's address, so you can copy the address and send somebody exactly what you are looking at. They see it at their own scope, which may be narrower than yours.
Export a report
-
On the report page, select Export.
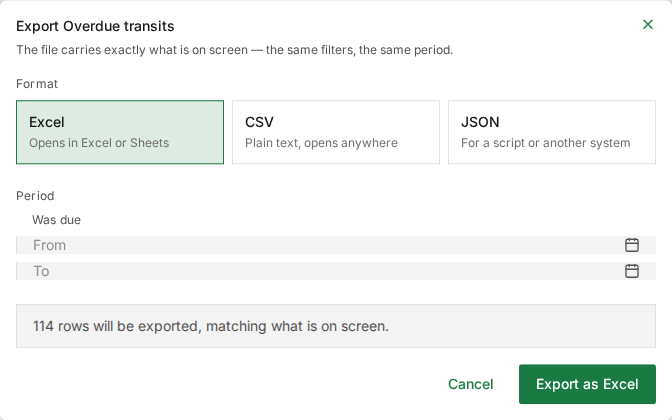
-
Choose the format:
Format Use it for Excel (the default) Opening in Excel or Sheets. CSV Plain text that opens anywhere. JSON A script or another system. -
Check the number of rows the window says will be exported. It is the same filters and the same period as the table on screen.
-
Select the export button to download the file. To leave without downloading, select Cancel.
The file is named after the report, for example overdue-transits.xlsx.
An export has a maximum size. If the download fails, the portal says That export did not download. Try a narrower period — an export is capped. Choose a shorter period or add a filter and try again.
Known problems
On the current version, the same quantity can read differently on two screens for the same period. On the development system in September 2026:
- Discharged is 330 on Transit volumes, but Where declarations are on Register counts 320 declarations as discharged.
- Departed is 384 on Transit volumes and 372 on the Overview funnel.
- The median crossing is 2.3h on Time & delays and 2.4h on the Overview.
- For Tunisia, Transit volumes says Departed 1 for a declaration that is still Registered.
Say which screen a figure came from when you pass it on, and prefer the Register area for counts of individual declarations.
Several tiles show stored codes rather than words: declaration states
(DISCHARGED, IN_TRANSIT, REGISTERED), refusal reasons (NOT_ENTITLED),
delivery results (ACKED, PENDING) and country codes. The
Glossary explains them.
On a month, the time charts label every point with the month ("Sept 26") rather than the day, and some charts repeat their own title inside the tile. Hover over a point to see its date, or use View as table.