Audit trail
Audit trail is the record of what was done in ITS: every sign-in, every request a signed-in person or connected system made, and every change written to the data. Use it to answer "who did this, and when?", to follow what one person did during one sign-in, or to see why a call was refused.
The screen has two tabs:
| Tab | What each row is | Page |
|---|---|---|
| Activity | One event: a sign-in, a request or a data change. | This page |
| Sessions | One sign-in session, from sign-in to sign-out, with what it did in total. | Sessions |
Nothing on either tab changes anything. You read, filter and open entries; there is no button to edit, delete, export or download.
Before you start
- You need the Secretariat admin or System admin role. See What each role can do.
- A State Party's or REC's administrator cannot open the audit trail. The trail is not divided by organisation, so opening it to one State Party would show it every other State Party's activity. Audit trail is not in their All areas panel, and its address shows You do not have access to this area with the line Ask the Secretariat to check the role on your ITS account.
- The screen reads recent activity only. Older activity is archived and is not read here. See What the messages mean.
| You are signed in as | What the trail covers |
|---|---|
| Secretariat admin | The activity of ITS, for every State Party and REC. |
| System admin | The activity of ITS and of the other products that share the installation's audit trail. |
How to open it
- Select All areas in the header (
⌘K/Ctrl+K). - Under Administration, select Audit trail.
The page opens on the Activity tab, newest event first.
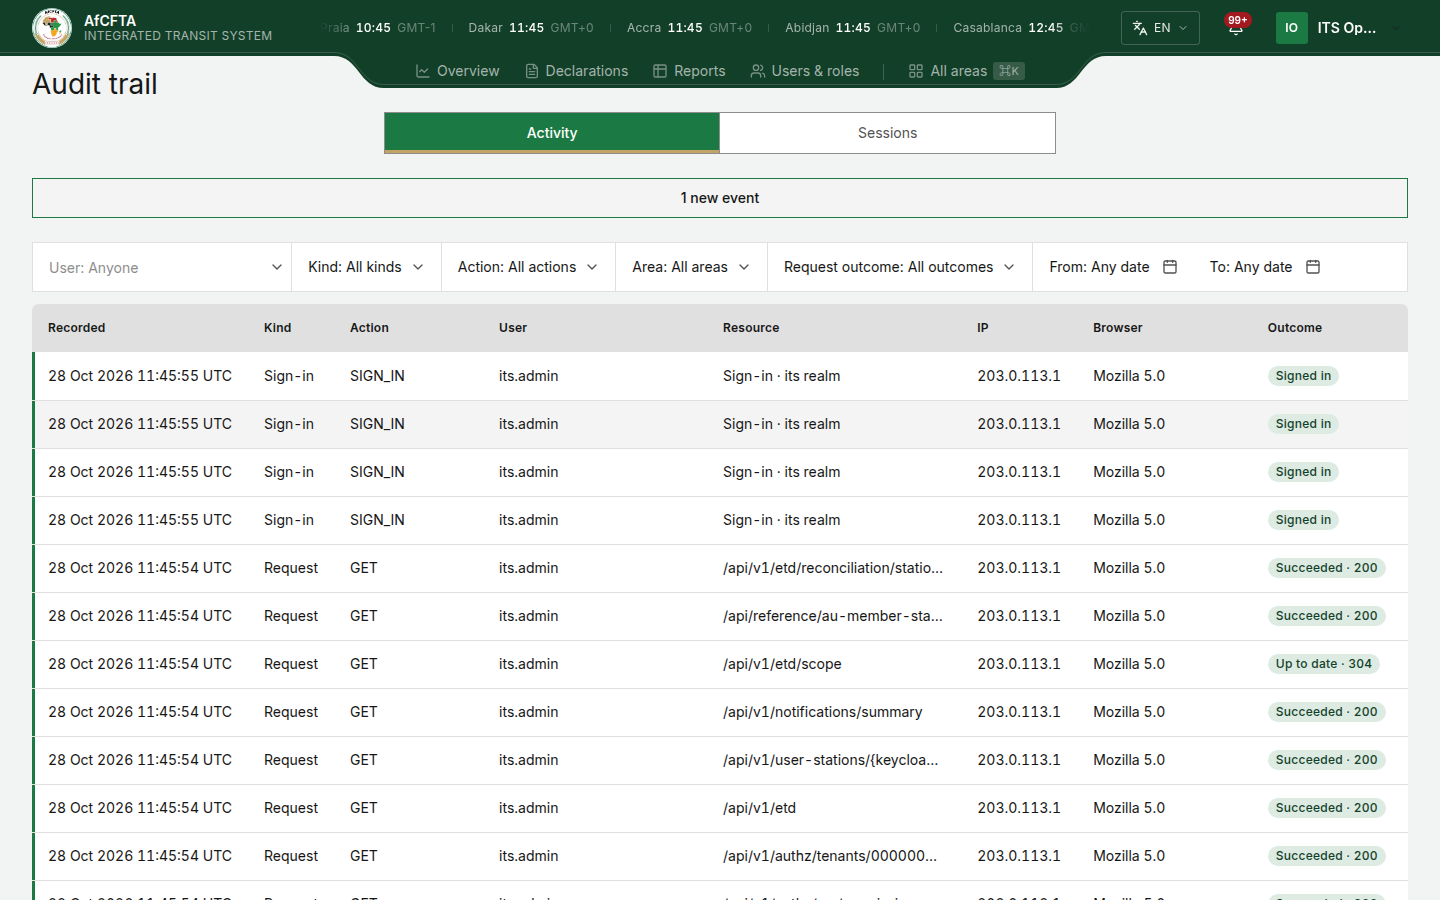
The page at a glance
| On the page | What it is for |
|---|---|
| Activity and Sessions | Move between the two tabs. Filters are not carried from one tab to the other. |
| A bar reading, for example, 12 new events | Events recorded since you loaded the list. See New events. |
| The filters | Narrow the list. See Filter the list. |
| The table | One row per event, 50 to a page unless you change it. |
| The footer | Items per page:, where you are in the list, and the Previous and Next arrows. See Move through the list. |
The columns
| Column | What it shows |
|---|---|
| Recorded | When the event was recorded, to the second, in your own time zone, for example 21 Sep 2026 01:27:09 UTC+3. The month is written in the portal's language. |
| Kind | Data change, Sign-in or Request. |
| Action | What was done, as it was recorded: for a request its method (for example GET), for a sign-in the event (for example SIGN_IN). — when nothing was recorded. |
| User | The username. Hover over it for the user's id. A data change made by ITS itself, not by a person, reads System. |
| Resource | What it was done to. For a request, the address that was called, for example /api/v1/etd/ZAJNBTD2608131. For a sign-in, Sign-in and the realm signed into. For a data change, the type of record and its id. |
| IP | The address the request came from. Hover over it for every address it was forwarded through. |
| Browser | The browser and system, for example "Chrome 141 · macOS", or the tool a connected system called with, for example "curl 8.7". Hover over it for the full text the caller sent. |
| Outcome | What happened, as a coloured tag. See below. |
The left edge of each row carries the colour of its outcome, so refusals and failures stand out when you scroll. Grey outcomes have no coloured edge.
Every column is always shown. When the table has less room than it needs, for example on a phone or with the detail panel open, it scrolls sideways inside its own box: scroll it to reach IP, Browser and Outcome.
The Outcome tags
A request's tag ends with the response code, for example Not found · 404.
| Tag | Colour | Meaning |
|---|---|---|
| Succeeded | Green | The request went through. |
| Up to date | Green | The request went through; the caller already had the current copy. |
| Signed in | Green | A successful sign-in. |
| Not signed in | Red | The request was refused because the caller was not signed in (401). |
| Access denied | Red | The request was refused because the caller's role does not allow it (403). |
| Server error | Red | ITS failed while handling the request. |
| Sign-in failed | Red | A sign-in that did not succeed. |
| Not found | Amber | What was asked for does not exist (404). |
| Conflict | Amber | The request clashed with the record's current state (409). |
| Rejected | Amber | ITS understood the request and refused its content (422). |
| Refused | Amber | Any other request that could not be honoured as asked. |
| Signed out | Grey | A sign-out. |
| Session refreshed | Grey | A session renewed itself in the background. |
| Redirected | Grey | The caller was sent to another address. |
| Recorded | Grey | A fact with no verdict: every data change, and any event that carries no result. |
Filter the list
-
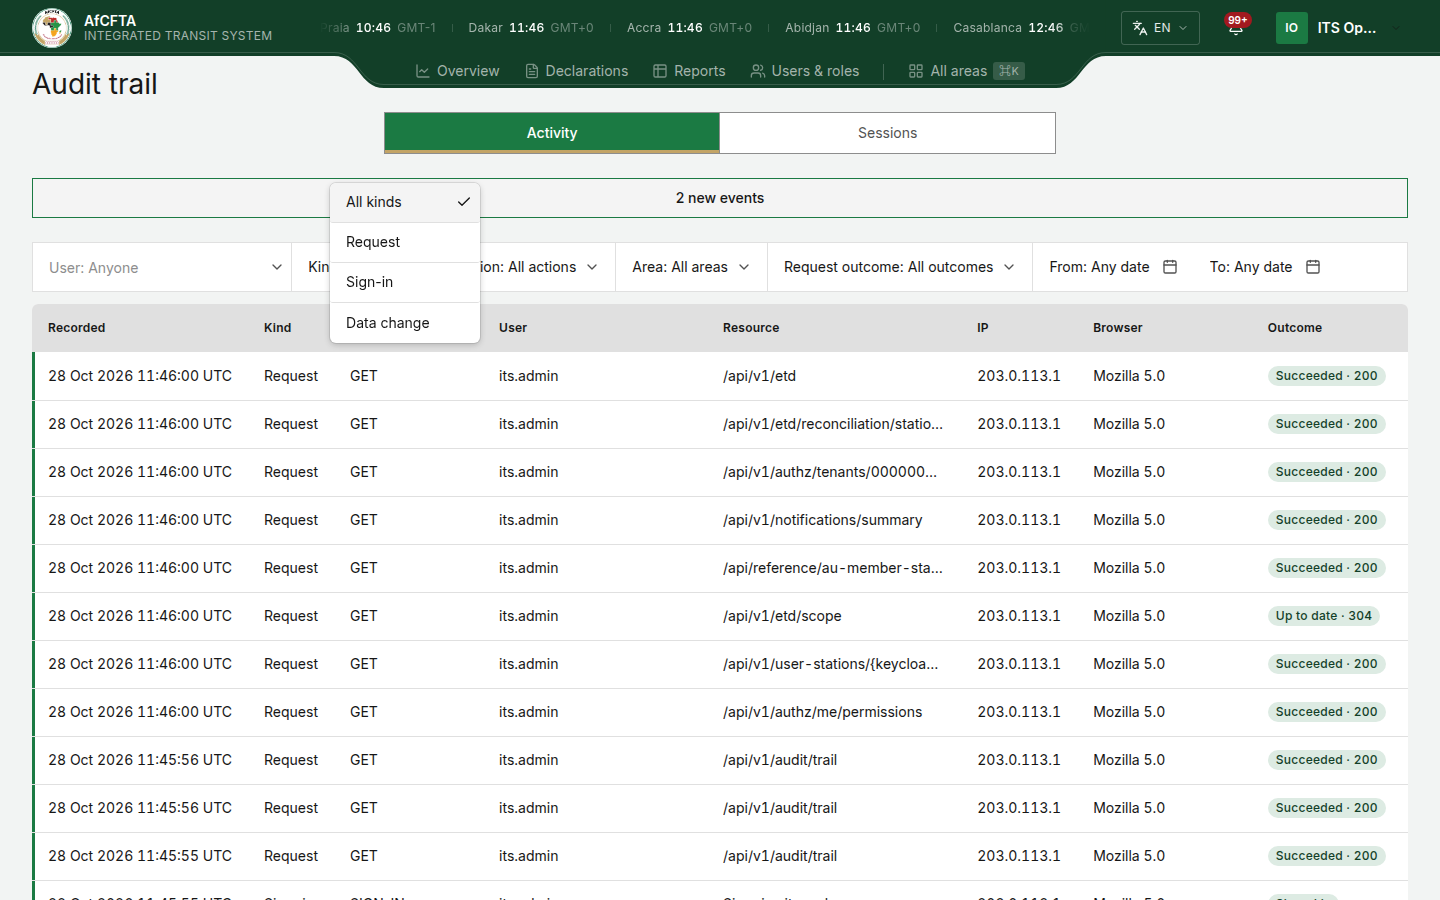
Select a filter above the table.
-
Choose a value. The list reloads from the newest matching event.
-
Add further filters to narrow it more. Every filter you set applies together.
-
To start again, select Clear filters. It appears as soon as one filter is set, and keeps your Items per page choice.
| Filter | Choices | Notes |
|---|---|---|
| User | Anyone, or one person | Type part of a name, username or e-mail address to search. People are listed as "First name Last name (username)", up to 20 at a time, and deactivated accounts are included. Searching… shows while it looks; Nothing matches that. means no account matches what you typed. |
| Kind | All kinds, Data change, Sign-in, Request | |
| Action | All actions, then every action the trail holds | The values are shown as they were recorded and are not translated. |
| Area | All areas, then every area the trail holds | The part of ITS's records a data change was written to. The values are shown as they were recorded and are not translated. |
| Request outcome | All outcomes, Success (2xx), Client error (4xx), Server error (5xx) | Applies to requests only. It cannot be used while Kind is Data change or Sign-in. |
| From, To | A day each; Any date when not set | The first and last day to read. Either can be set alone. |
Changing a filter returns you to the first page and closes the detail panel.
The Recorded column shows times in your own time zone, but From and To cut the day at midnight UTC. If you are ahead of or behind UTC, an event close to midnight can fall on the neighbouring day. Widen the range by a day when you are looking for one.
New events
While the page is open, the portal checks every 30 seconds for events newer than the top row, under the filters you have set. When there are some, a bar above the filters says how many, for example 12 new events.
- Select the bar.
The list reloads from the newest event and the bar goes away. The check pauses while the browser tab is in the background. There is no refresh button: the bar is how new rows arrive.
Read one entry
-
Select a row, or move to it with the keyboard and press
Enter.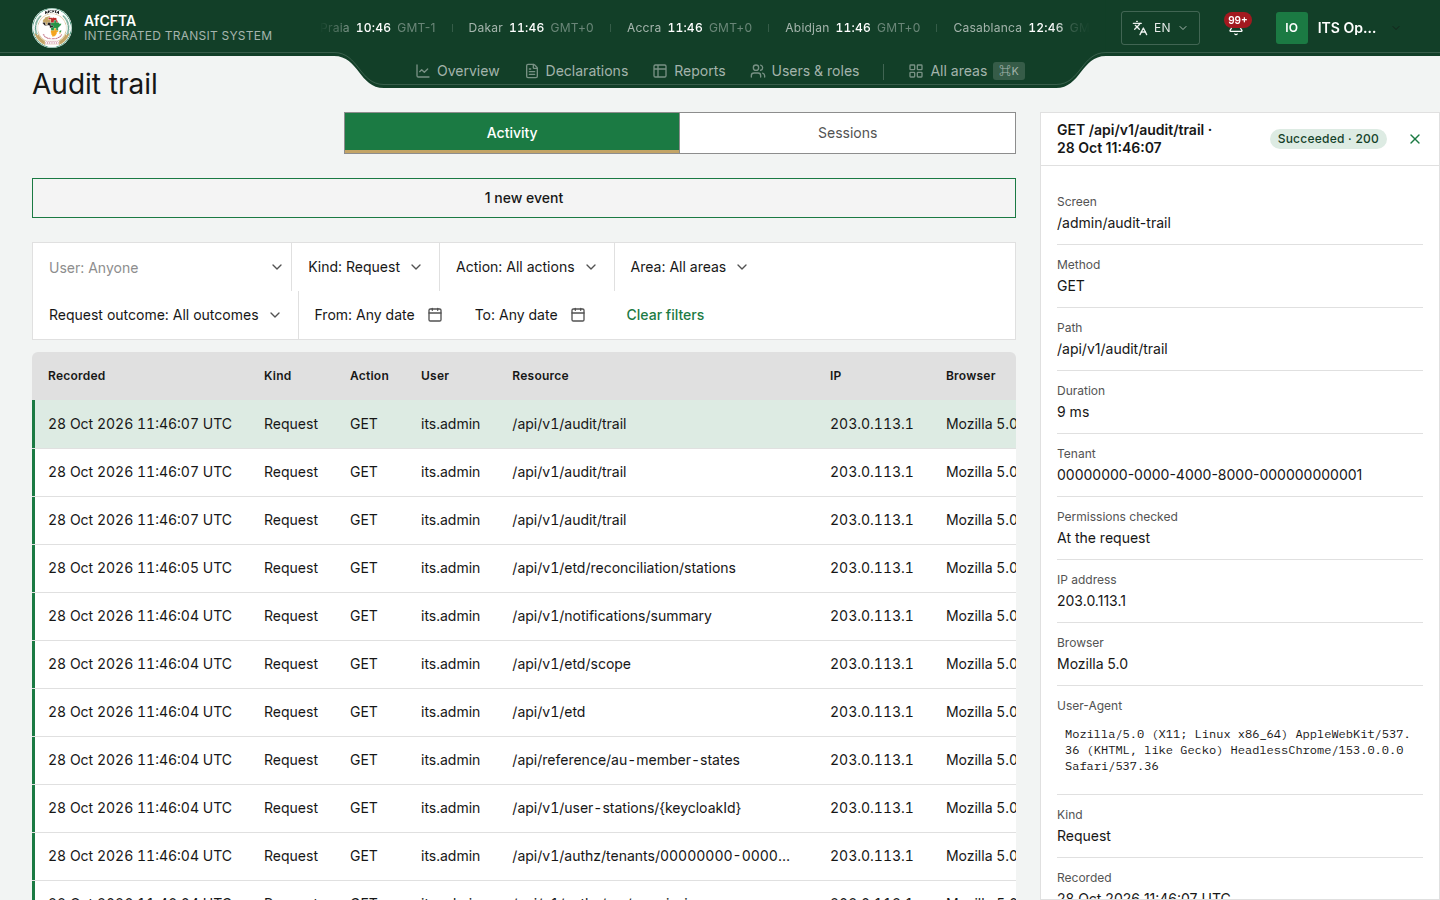
-
Read the panel at the right. Its title is what happened and when, with the outcome tag beside it.
-
Select Close panel (the ×) or press
Escto return to the list.
The panel shows only the fields that were recorded, so an entry can have fewer than the lists below. Hover over a time for its exact recorded value.
A request
| Field | What it shows |
|---|---|
| Screen | The portal screen the request was made from, where one was recorded. |
| Method | The kind of call, for example GET to read or POST to send. |
| Path | The address that was called, with the record's own identifiers filled in. |
| Route template | The same address with placeholders, shown only when it differs from Path. |
| Path parameters | The identifiers that were filled in, by name. |
| Duration | How long ITS took to answer, in milliseconds. |
| Tenant | The tenant the request was made for, as recorded. |
| Permissions checked | When the caller's permissions were read for this entry: At the request or At the write. |
| IP address | The address the request came from. |
| Forwarded through | The addresses that passed the request on, in order, when there were any. |
| Browser, User-Agent | The browser or tool as the portal reads it, then the full text the caller sent. |
A data change
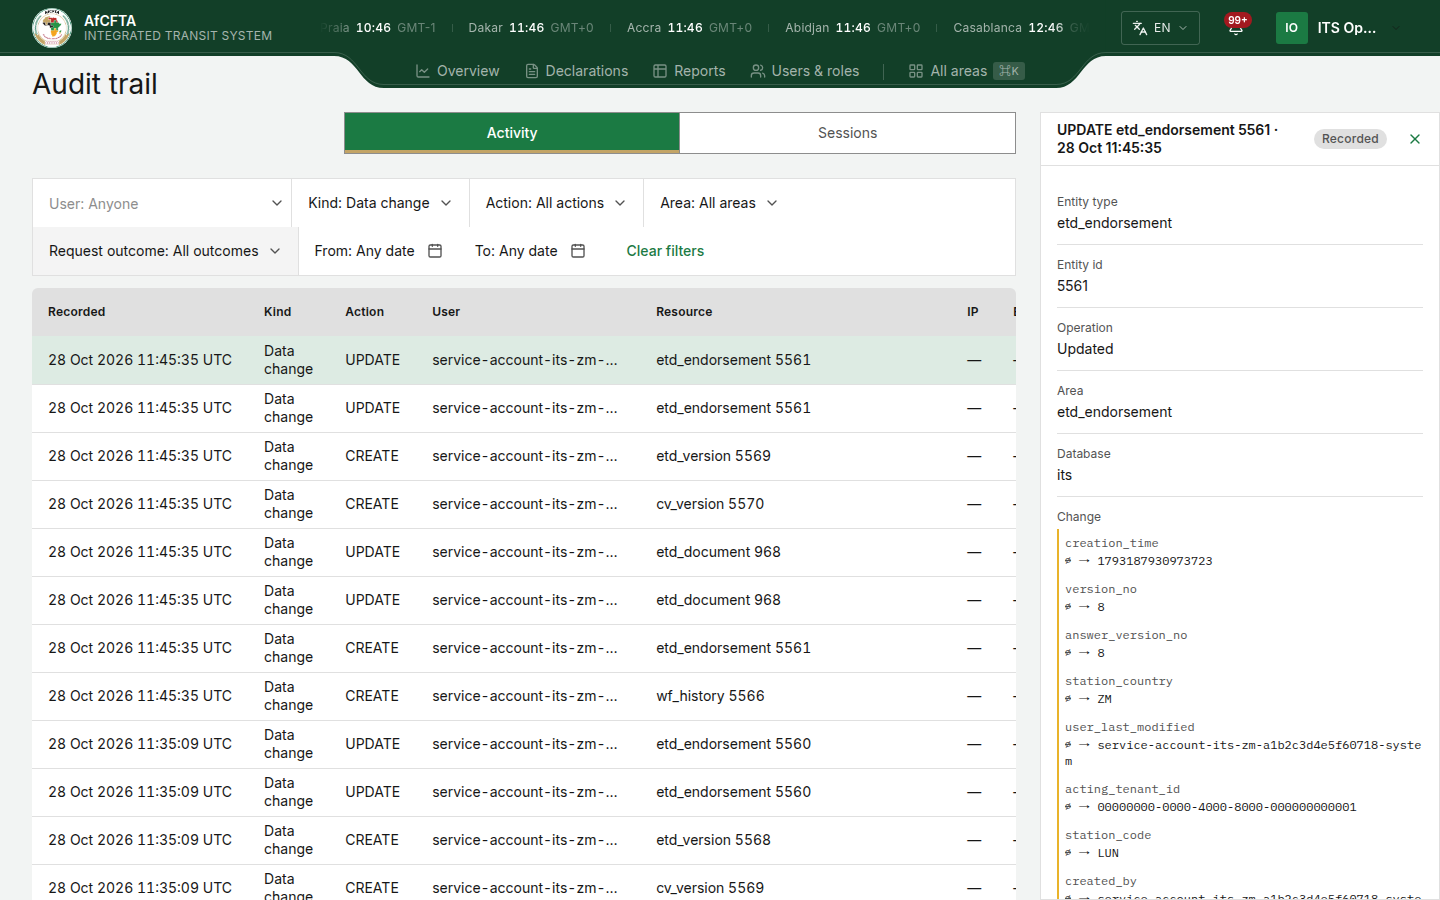
| Field | What it shows |
|---|---|
| Entity type, Entity id | The type of record that changed, and which one. |
| Operation | Created, Updated, Deleted, or Snapshot for a copy of a record taken as it stood. |
| Area | The part of ITS's records the change was written to. |
| Database | The database the change was captured from. |
| Change | What changed, column by column. |
In Change, each changed column is listed with its old value struck through, an arrow, and its new value. ∅ stands for "no value". Columns that did not change are folded under a line such as 14 unchanged columns; select it to open them. No column changed. means the record was written again with the same values. If the stored record cannot be laid out column by column, the panel shows it whole under Before and After instead.
A sign-in
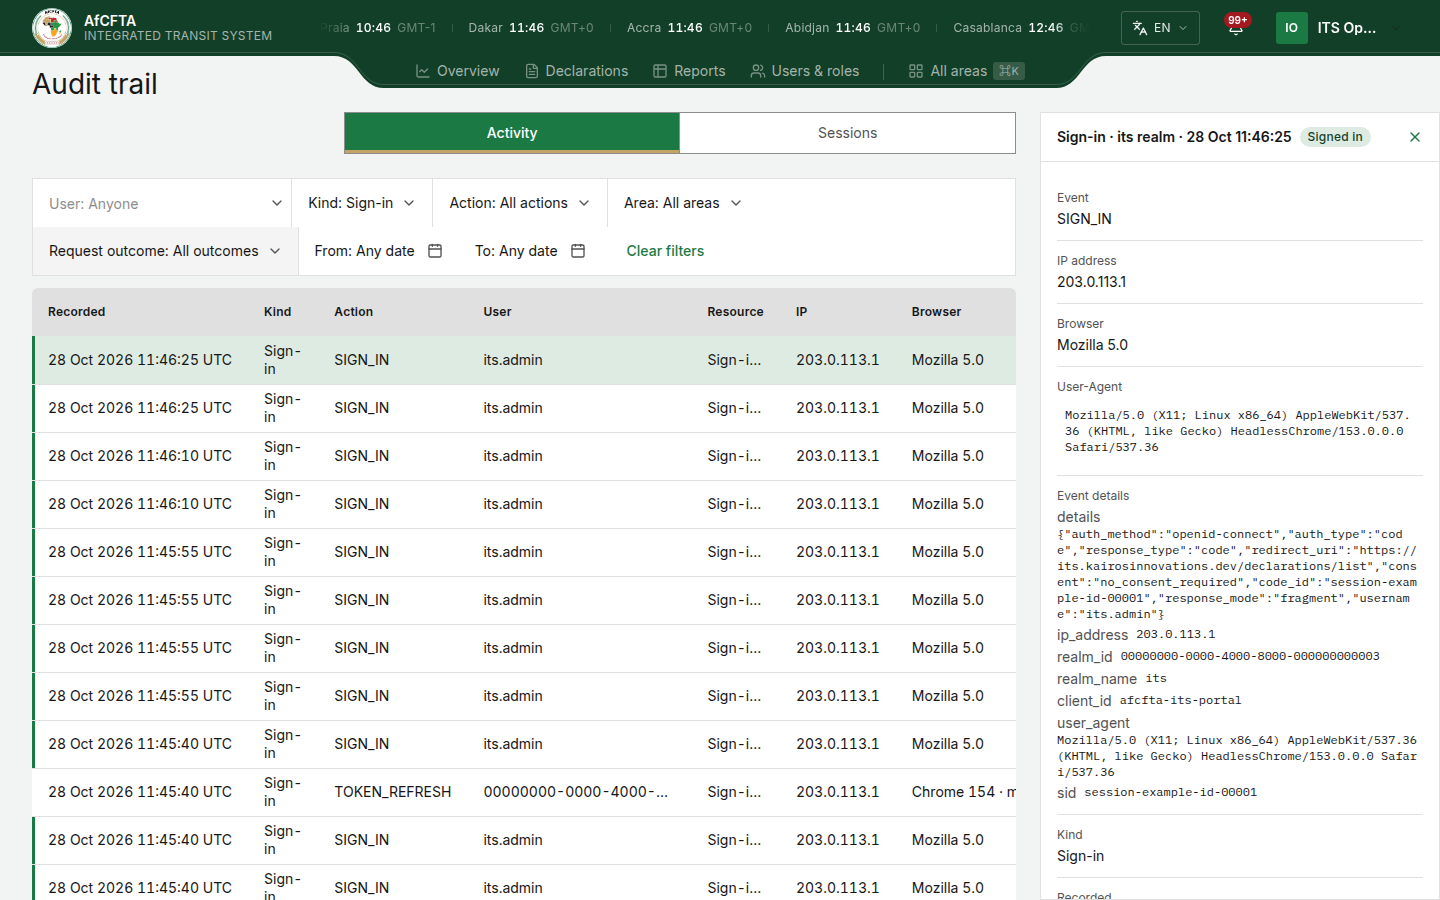
| Field | What it shows |
|---|---|
| Event | The event as recorded, for example SIGN_IN or SIGN_IN_FAILED. This is the value the Action filter takes. |
| Error | Why a sign-in failed, as recorded. |
| IP address, Forwarded through, Browser, User-Agent | Where the sign-in came from, as for a request. |
| Event details | Further details the sign-in service recorded, by name. |
Fields every entry has
| Field | What it shows |
|---|---|
| Kind | Data change, Sign-in or Request. |
| Recorded, Occurred | When the trail recorded the event, and when it happened. |
| User, User id | The username, and the account's id. Quote the id when you report an entry to support. |
| Realm, Client | The sign-in realm, and the application or connected system that was signed in. |
| Session | The id of the sign-in session the event belongs to. |
| Correlation id | The reference that ties this entry to the same request elsewhere in ITS. It is the reference an error message shows. |
Move through the list
| In the footer | What it does |
|---|---|
| Items per page: | 10, 20, 50 or 100 rows. Changing it starts again from the newest event. |
| The range, for example 1–50 of 1,234 events | Where you are, and how many events match your filters. A total ending in +, such as 10,000+, means the count stopped at its limit and there are more. Until the count arrives the range reads 1–50 alone. |
| Previous (‹) | Newer events. |
| Next (›) | Older events. |
There are no page numbers: the list is walked from the newest event backwards.
Every filter, the page you are on and the open entry are kept in the page's address, so the browser's Back button retraces your steps. When an address opens part-way through the list, the range in the footer is approximate.
What the messages mean
| You see | What it means | What to do |
|---|---|---|
| Grey placeholder rows | The list is still loading. | Wait. |
| No activity found, "Try a different filter, or a wider date range." | Nothing matches your filters. | Remove a filter or widen From and To. |
| Older activity is archived, "This range reaches earlier than the trail's hot window. Rows that old are sealed to the archive and are not read on this screen." | From or To is earlier than the period this screen reads. | "Choose a more recent date range." |
| Audit trail unavailable, "The audit service could not be reached or failed, so recorded activity cannot be read right now." | The trail cannot be read at the moment. | Select Try again after a minute. "If it keeps happening, report it to support." |
| Another error message, sometimes with a Reference | The request failed for another reason. | Select Try again where it is offered. When you report it, copy the reference with the Copy reference button beside it. |
The same messages appear inside the detail panel when one entry cannot be read.